Cells must accurately replicate their DNA during cellular division. A recent structural study has determined how a bacterial DNA replication helicase complex is loaded unto DNA yielding insights into the early stages of DNA replication. NCDIR researchers from the Chait lab contributed to this structural work by performing native mass spectrometry (MS) and cross-linking MS analysis to derive stoichiometry and subunit connectivity restraints that are critical for mapping the architecture of the helicase:loader assembly.
Figure 2: Architecture and Stoichiometry of the E. coli DNA Helicase•Bacteriophage λP Complex. (A) Experimental EM density map of the E. coli DnaB helicase•bacteriophage λP complex. (B) Same as panel A except that the map has been rotated by 90°. (C) The E. coli DnaB helicase•bacteriophage λP complex depicting the ruptured interface between DnaB subunits A and B, and the deep canyon that runs through the complex. The complex has been sub-divided into three tiers: λP loader (individual chains are colored in shades of orange), the DnaB CTD (colored in alternating blue and cyan), and the DnaB NTD tiers (colored in alternating dark and light gray). The DnaB CTD-NTD linker helix (residues 182-202) is colored yellow and the DnaB CTD helix (residues 291-302) that is involved in λP binding interactions is colored green. (D) Same as panel C except that the model has been rotated by 90°. The five λPmolecules in the complex are labeled λP1 (chain Z), λP2 (chain Y), λP3 (chain X), λP4 (chain W), and λP5 (chain V).
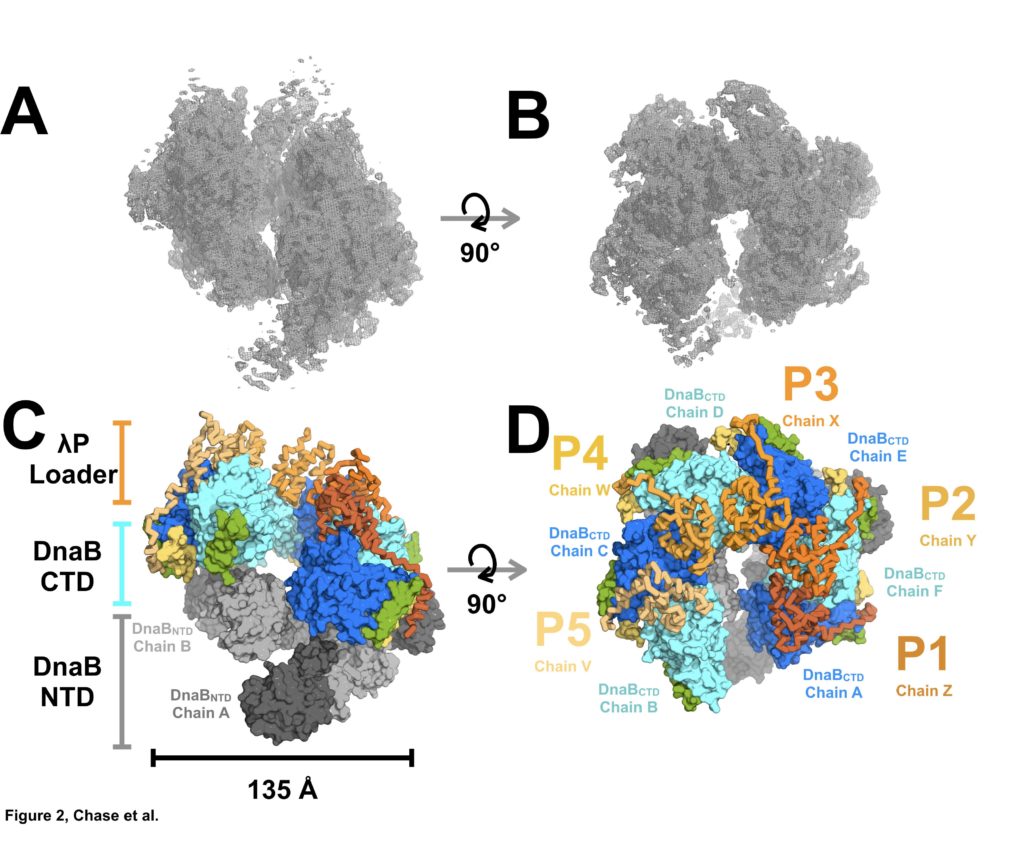
Figure 3: Stoichiometry and Chain Direction in the DnaB• λP complex. (A) Linear representations of the amino acid sequences of E. coli DnaB and λP colored in purple and yellow, respectively, to indicate the portions of each protein that are visible in our EM density maps. Architectural landmarks of each protein are indicated. The black vertical lines represent lysine residues. The black lines between DnaB and λP represent intermolecular crosslinks provided by the CX-MS procedure. (B) The CX-MS derived intermolecular crosslinks are plotted onto DnaB chain C, λP4 chain W, and λP5 chain V of the BP model. All lysine residues are depicted as orange spheres. Lysine residues reported by CX-MS to have been crosslinked are numbered.Colored in red is the sole lysine pair whose distance exceeds 30 Å. The various chains of the DnaB and λP are outlined. (C) Native MS analysis of the E. coli DnaB helicase•bacteriophage λP complex. The most intense peak series corresponds to the B6P5 assembly, with lower relative intensity peaks indicating presence of subpopulations of B6P4 and B6P6. (D) Incubation of the DnaB•λP sample from panel C with an origin-derived 13.1 kDa 43-mer ssDNA yielded a single peak series with a mass corresponding to the B6P5 assembly with one bound origin-derived ssDNA molecule.
For further details, the paper is available at: https://elifesciences.org/articles/41140
Paper: Chase J, Catalano A, Noble AJ, Eng ET, Olinares PDB, Molloy K, Pakotiprapha D, Samuels M, Chait B, des Georges A, Jeruzalmi D. Mechanisms of opening and closing of the bacterial replicative helicase. Elife. 2018 Dec 24;7. pii: e41140. doi:10.7554/eLife.41140. [Epub ahead of print] PubMed PMID: 30582519.